

Reviewed on 25 October 2026. Core Web Vitals describe three parts of a visitor’s experience: how soon the main content appears, how quickly the page responds, and whether the layout moves unexpectedly. Start with those problems rather than chasing a perfect PageSpeed score.
For a business website, the test is straightforward: can a customer read the offer, use the menu and send an enquiry without waiting or losing their place? This guide explains how to measure that experience and decide which repair to make first.
The three Core Web Vitals to measure
| Metric | What it measures | Google’s good threshold |
|---|---|---|
| Largest Contentful Paint (LCP) | When the largest visible image or text block renders | 2.5 seconds or less |
| Interaction to Next Paint (INP) | How quickly the page paints a response to user interactions | 200 milliseconds or less |
| Cumulative Layout Shift (CLS) | Unexpected movement of visible content | 0.1 or less |
These thresholds apply at the 75th percentile of real visits, assessed separately for mobile and desktop. INP replaced First Input Delay (FID) as a Core Web Vital in March 2024. An older report that focuses on FID needs updating.
Read the definitions in Google’s Web Vitals documentation. A page needs to meet all three thresholds to pass the Core Web Vitals assessment when sufficient field data is available.
Use field data and a laboratory test for different jobs
Start with the experience of real visitors
Open PageSpeed Insights, enter the page URL and look at the real-user section first. Where available, it uses Chrome User Experience Report data over a rolling 28-day period. Check whether the result describes that URL or the wider origin; they are not interchangeable.
Search Console’s Core Web Vitals report groups similar URLs with issues. Use it to find affected templates, then inspect representative pages. If a small site has insufficient field data, the missing assessment does not mean the page passes or fails.
Use Lighthouse to investigate a problem
The laboratory section runs a controlled simulation. Its performance score changes with server response, device simulation and third-party services. Use the diagnostics and rendering timeline to find causes, then repeat comparable tests after a change.
Lighthouse Total Blocking Time can help investigate main-thread work, but it is not a measurement of field INP. Test actual menu, filter, form and consent interactions as well. Google’s lab and field data explanation describes why the two views can disagree.
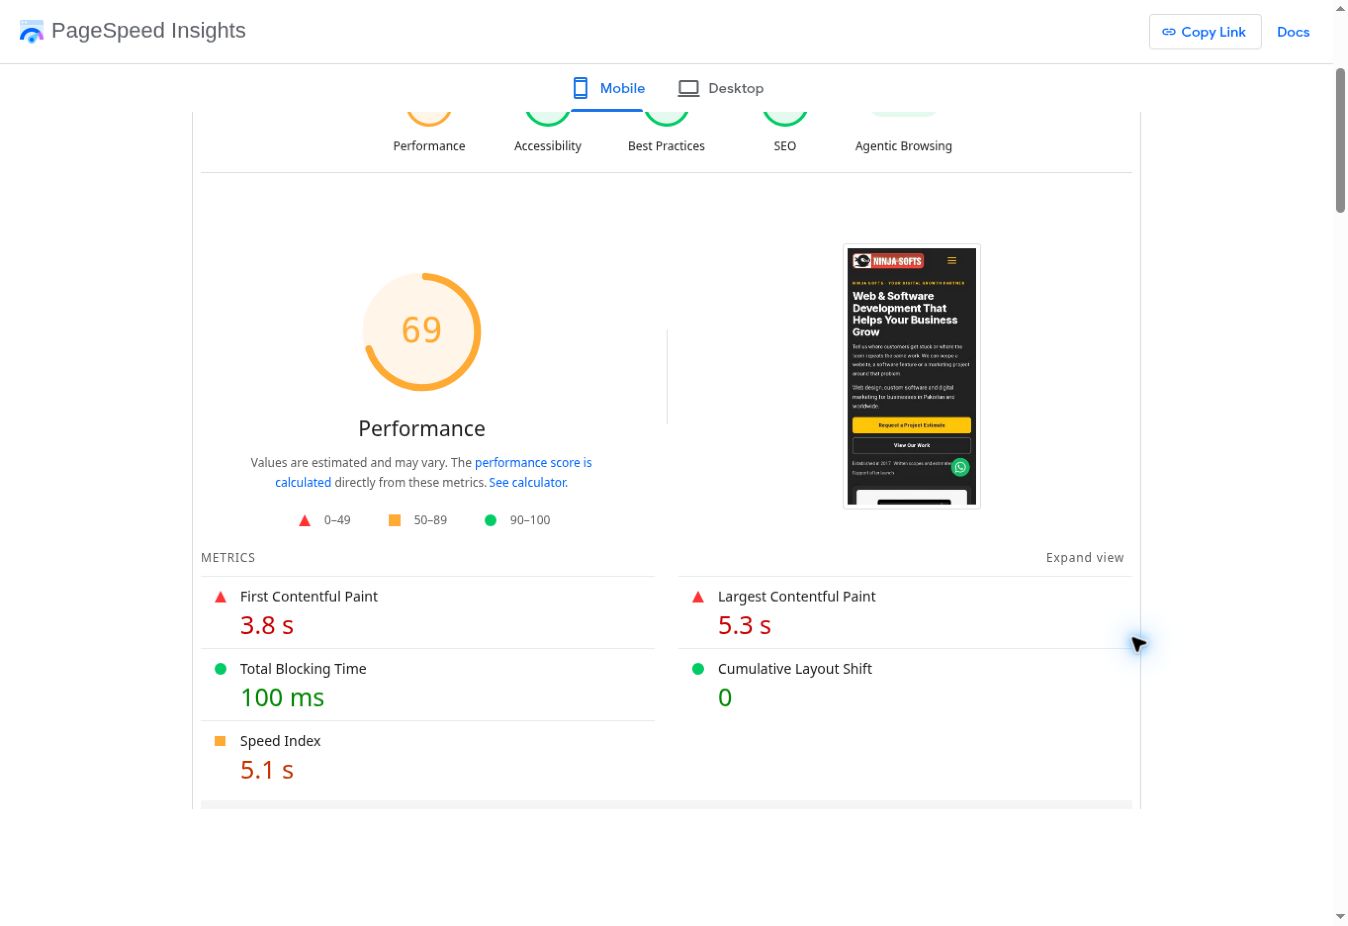
Fix LCP by finding what the visitor is waiting for
The LCP element may be a heading rather than a photograph. Identify the element in the report before changing image settings.
If it is an image, check its dimensions, compression, discovery and loading priority. An important first-screen image should not wait for lazy loading or a slider to initialise. Use responsive image candidates so a phone does not download a desktop-sized asset unnecessarily.
If it is text, investigate font requests, blocking stylesheets and styles arriving late. A heading can remain invisible while the browser waits for its font or while JavaScript hides a section. Google breaks the problem down in its LCP optimisation guide.
Check server response and page-cache behaviour too. A warm test and an uncached visit can produce very different results. Test both, including the cache bypass needed for logged-in users and dynamic pages.
Fix INP by testing the actions customers take
Open the mobile menu, expand an FAQ, choose a product option and use the enquiry form. When one of these feels delayed, inspect the interaction in Chrome DevTools.
Long JavaScript tasks, large DOM updates and repeated layout calculations can prevent the browser from painting a response. Remove unnecessary work, split lengthy processing where possible and load feature-specific scripts only where the feature exists. Adding another animation does not address the delay.
Use Google’s INP guide to interpret the metric. A low blocking-time result on page load does not prove that every later interaction responds promptly.
Fix CLS by reserving space and loading essential styles early
Images, video players, advertisements and embedded reviews should have space reserved before their content arrives. Avoid inserting banners above text after a visitor starts reading.
Check font changes and late CSS as well. On a builder-based page, a style module placed after the heading it controls can let the browser paint the wrong layout first. The repair may be source order, not a redesign. Keep the required hero and navigation styles available before paint.
Google’s CLS documentation also explains why shifts immediately following certain user actions are treated differently from unexpected movement.
A repair log that makes results comparable
Record the URL, device mode, date, test conditions, LCP element and relevant metrics. Change one meaningful dependency at a time. Test the same page again, then check the menu, forms, fonts and layouts rather than relying only on the score.
| Finding | First investigation | Verification |
|---|---|---|
| The heading renders late | Fonts, blocking CSS, hidden content | Heading appears with its intended layout |
| The hero moves while loading | Late styles, font metrics, missing media dimensions | Rendering timeline shows stable placement |
| The menu responds slowly | Long tasks and layout work during the interaction | Repeated interactions paint promptly |
| Reviews move nearby content | Embed dimensions and delayed insertion | Reserved space remains stable |
After publishing, monitor field data as new visits enter the reporting window. Do not expect a repair to replace the entire 28-day history immediately. A higher lab score alone also does not guarantee higher search rankings.
If you need help identifying the cause, send the affected URL and report with a website maintenance request. For wider search and technical work, explore our SEO services.